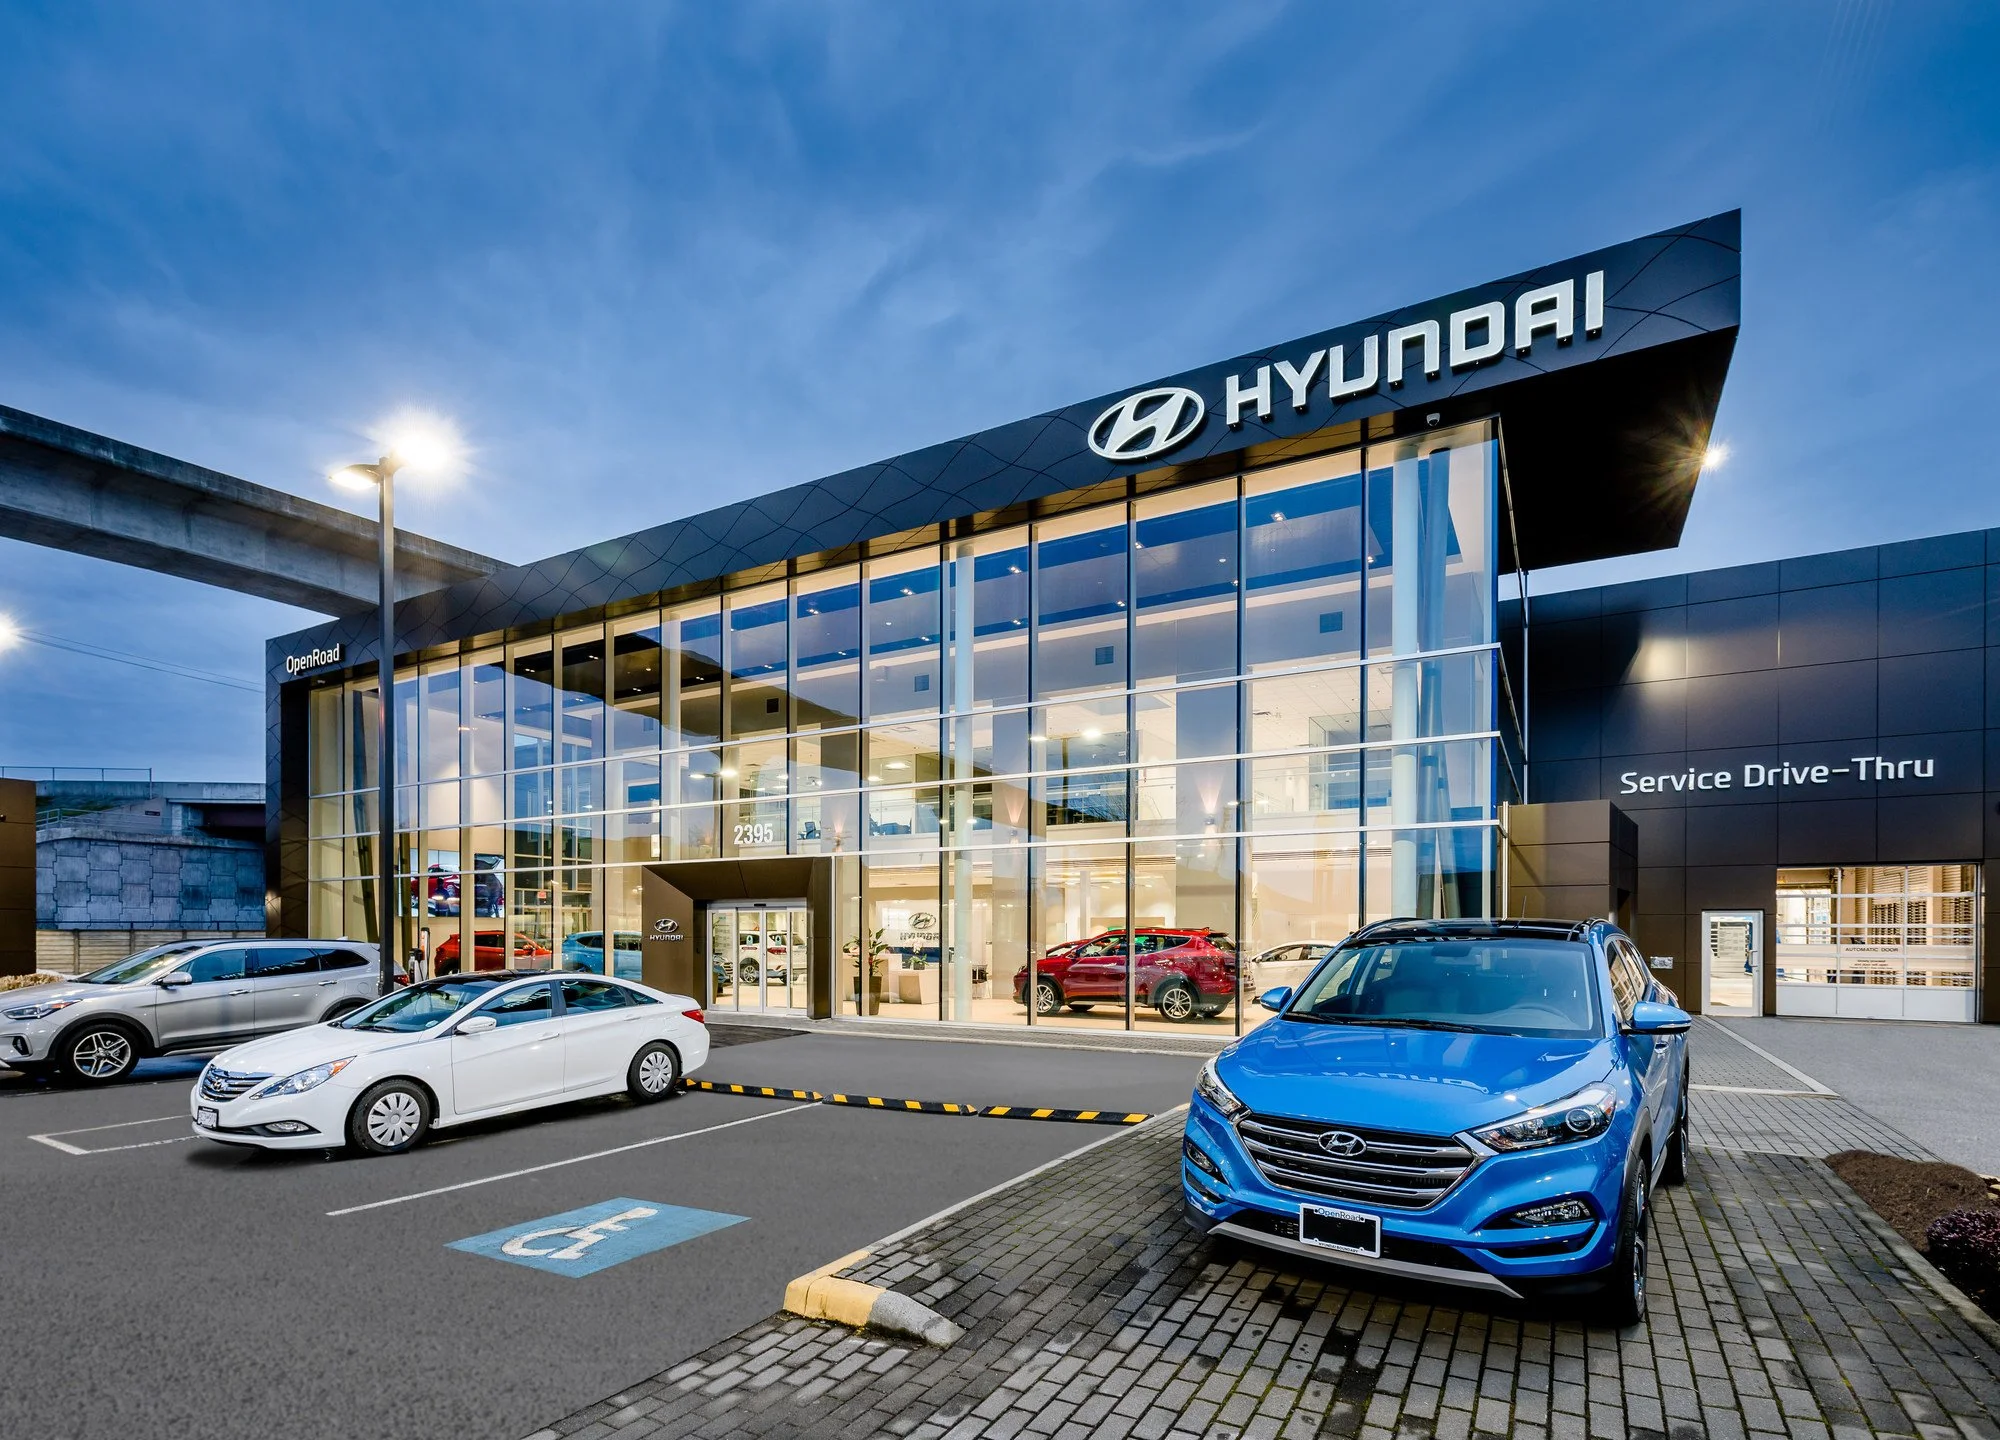
Hyundai Canada

The goal of this project was to gain insight into how users interact with various elements of the Hyundai Canada mobile and desktop website to improve the User Experience of first-time car buyers, such that Hyundai becomes the first choice for car purchases among millennials.
Team
Jenna Mussar, Joshua Isenberg, Maureen Ariza Parades
Tools
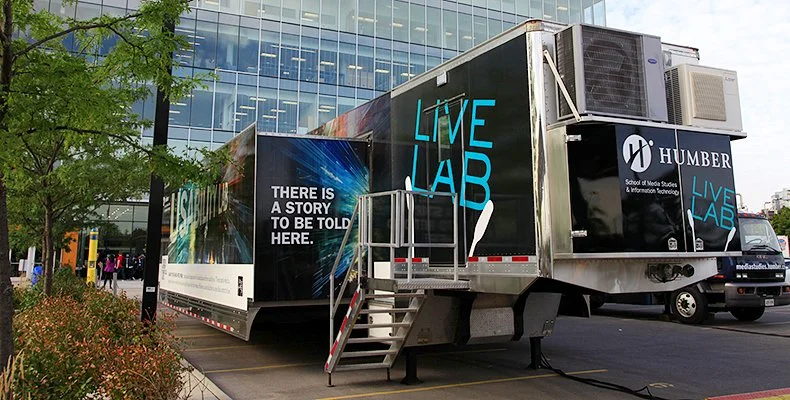
Humber College Usability Lab
Date
Fall 2017
Skills
Design Research
Eye Tracking
User Testing
Scan Paths
Heat Mapping
Intro
A key differentiator of millennials from other target groups is their tech-savviness, conscientiousness, and desire for instant gratification. Hyundai Canada can better appeal to this market by considering these characteristics when designing a user experience on its mobile and desktop platforms when users access the Hyundai Canada platform to buy their first car online. We began with a few preliminary research questions:
What are first-time car buyers looking for in a car website?
Should the focus be on deals and special offers? Customization? Ease of access? Or should the focus lie on how quickly and seamlessly the transaction is completed?
User-centred design methods and principles were employed to understand how users interact with the site and identify focus areas for improving the User Experience.

Overview
This project aims to gain insight into how users interact with various elements of the Hyundai Canada mobile and desktop website to improve the user experience of first-time car buyers, such that Hyundai becomes the first choice for car purchases among millennials. As such, the focus was broken down into three scenarios.
What are users’ initial impressions of the Hyundai Canada website?
How do users utilize the "Build and Price" tool when purchasing a car?
Does the "Book a Test Drive" tool allow users to complete all tasks necessary to book a test drive?
It was hypothesized that emphasis on special offers, personalization, customization, and autonomy will increase user engagement with both the mobile and desktop platforms leading to higher conversion rates from the new target audience for Hyundai Canada.Planning Phase
The testing focused on the usability of the three key areas. We recruited participants from the target demographic and ran them through structured scenarios, creating the scenarios to maximize the research findings related to the study’s research questions.
Eye-tracking data and several satisfaction scales and ratings yielded qualitative and quantitative data. We leveraged the data to discover which usability issues to focus on, compare our findings to previous research, and measure how the findings fit with Hyundai's Experience objectives, which we, as UX designers, expanded on.
We presented Hyundai Canada stakeholders with a digestible and concise report of the findings and design recommendations for feedback and further iteration.

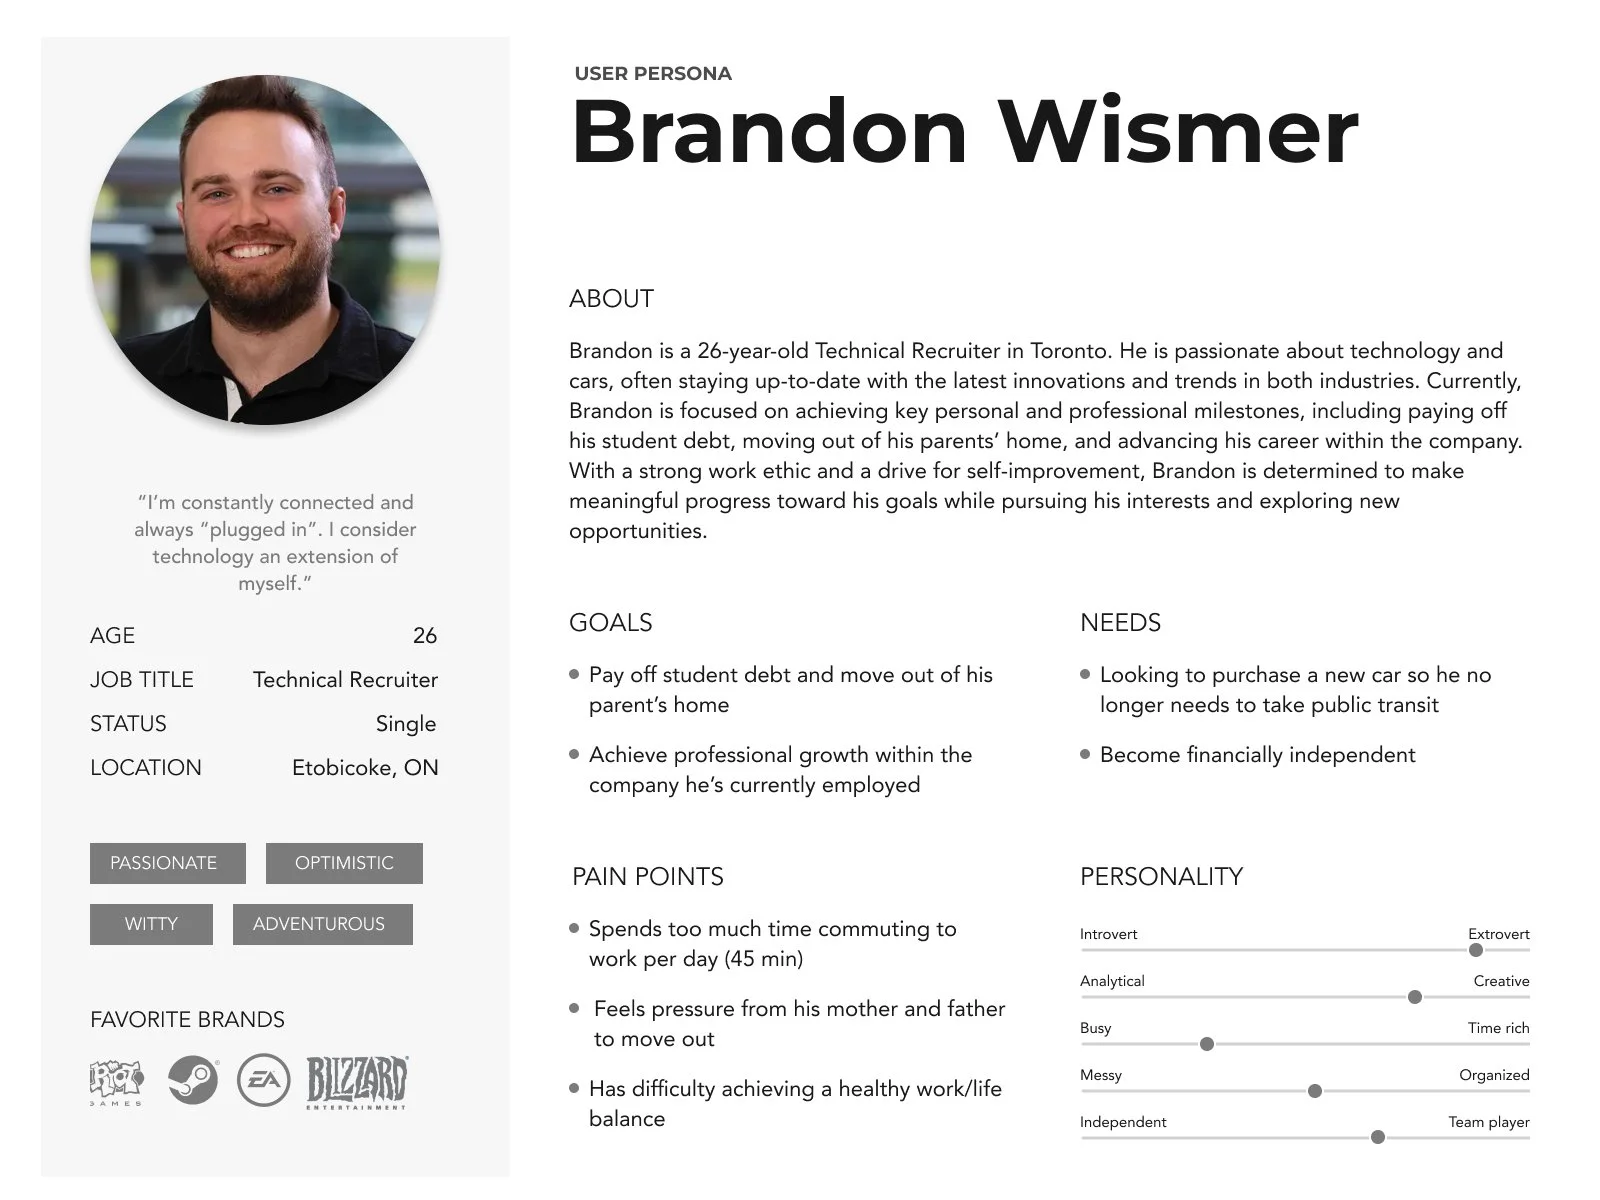
Recruitment Phase
User personas were first developed to provide a theoretical foundation for the type of participants to be recruited for user testing. Several screener questions were then employed to ensure that the correct participants were selected in accordance with both our persona and intended target demographic:
Is the user between 20-30 years of age?
Does the user live in a suburban area (i.e. Vaughn, Mississauga?)
Does the user have at least some post-secondary education?
Do they intend to buy a car within the next year?
Is their commute to work >1hr?
Does the user engage in online shopping?
Does the user still live at home?

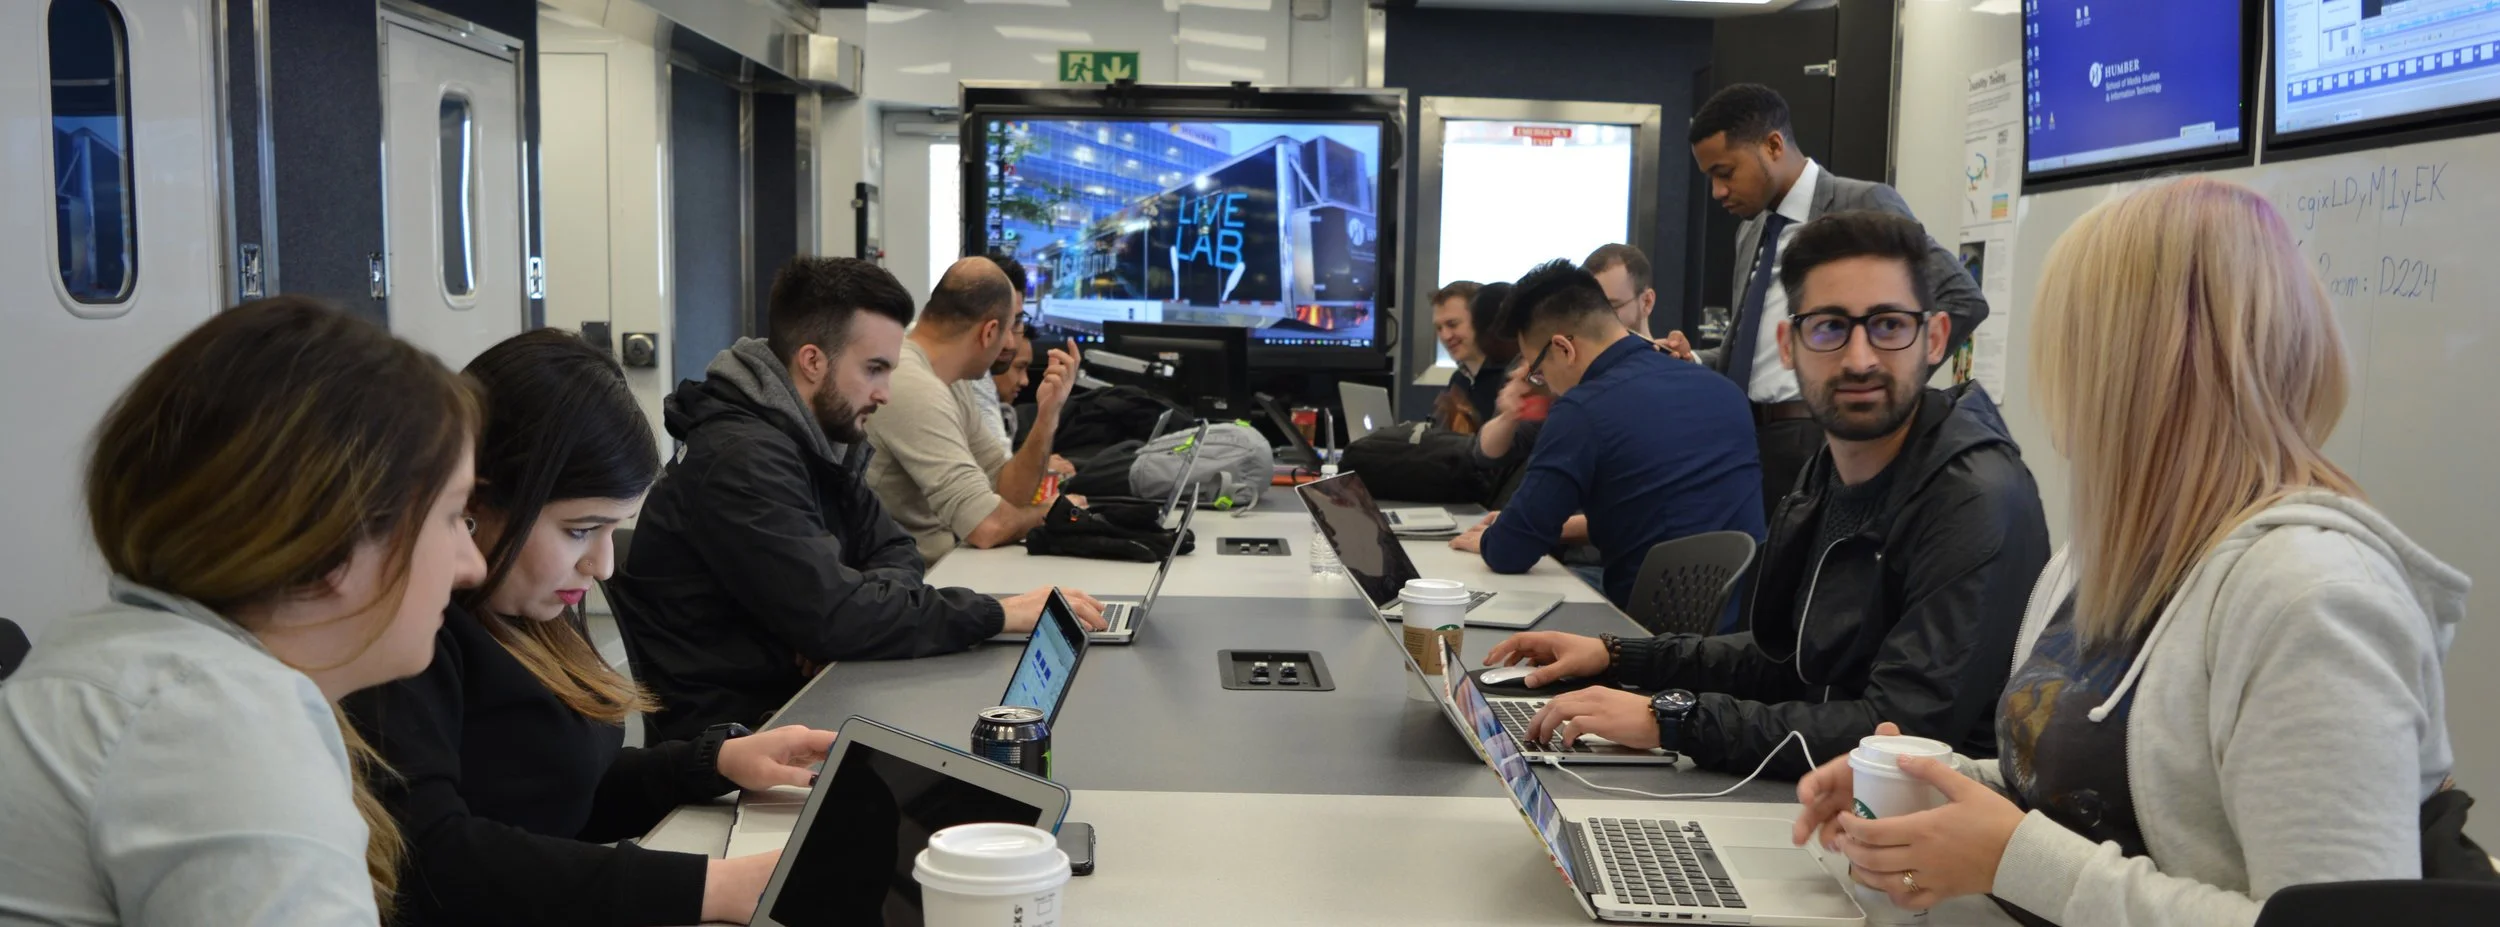
Testing Phase
We tested the user task scenarios on mobile and desktop platforms at the Humber College Usability Lab. We introduced all participants to the research and the eye-tracking and recording equipment and guided them through the three scenarios.
Participants were asked to voice their thought processes and provide feedback and comments about each experience. They were also encouraged to use their mobile devices to simulate an environment that was as realistic as possible. Satisfaction ratings were collected at the end of each session.
Usability Environment
Usability Tools & Materials
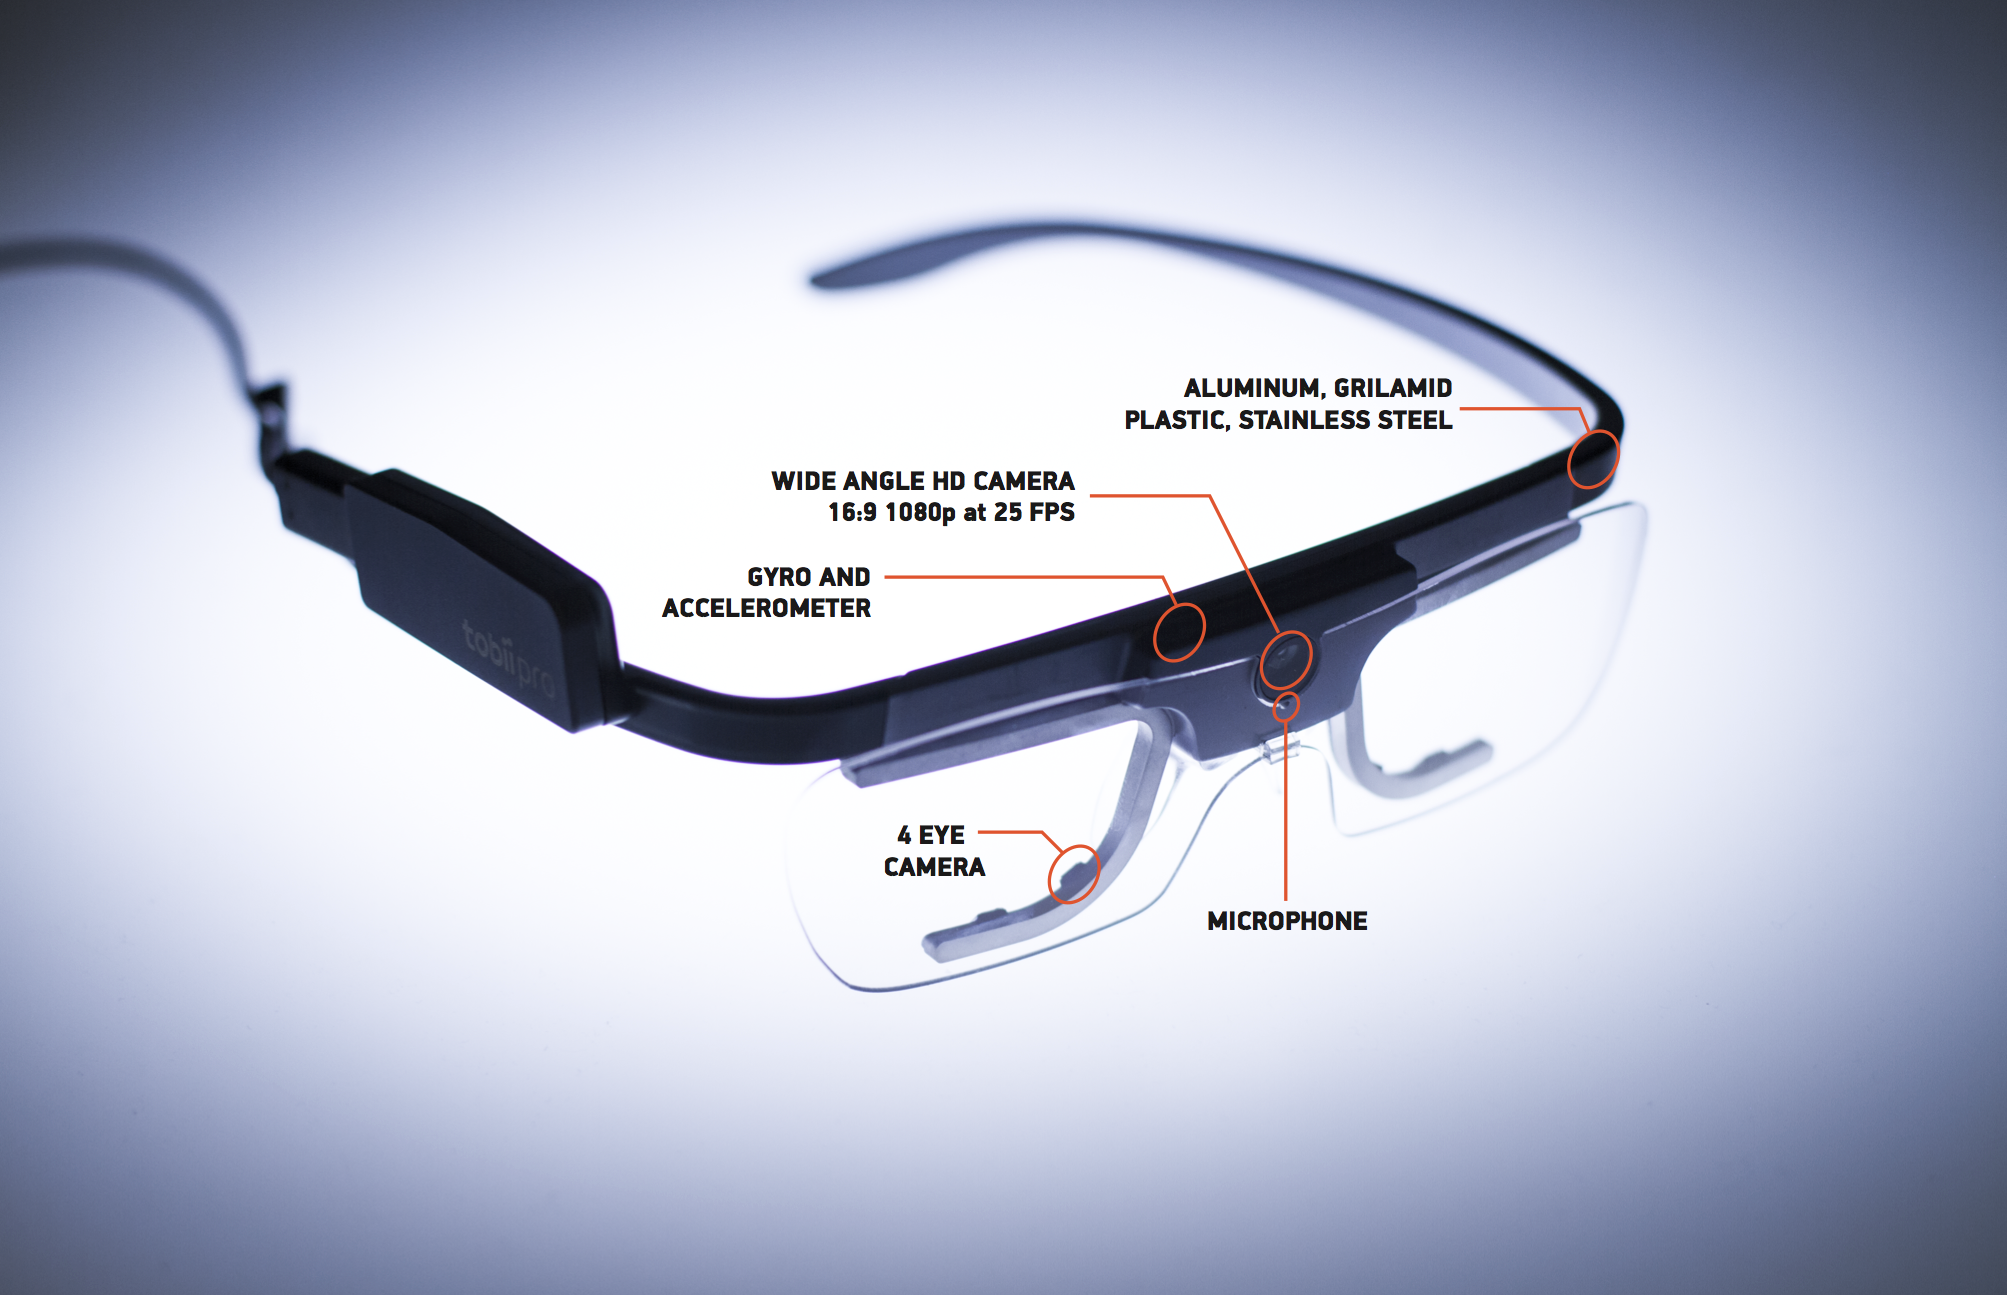
Eye Tracking
Using the Tobii eye-tracking software, users' eye movements were followed and tracked as they walked through each scenario, resulting in a visual depiction of the user task flow. The Tobii Glasses allowed for testing of the mobile platform in the most natural way possible, while the Sensor Bar allowed eye-tracking on a desktop. We used this software to identify and gather data on:
Where the user's attention is being directed
Completion rate of each task
Time spent on a task, page, or feature
Number of errors
User Testing Scenarios
Structured scenarios ensured that the data being collected was both consistent and accurate, allowing for better identification of areas of concern and new insights regarding how these users interact with the site. Key questions intended to be addressed through the conduction of user testing were:
Do users tend to look at the same image/ feature more than others?
Do users follow a specific task sequence within a scenario?
How similar and or different are users' mental models?
Does a certain feature/page seem more intuitive than another?

Satisfaction & Usability Scales
Creating a Satisfaction Scale and System Usability Scale allowed us to quantify the satisfaction of the users' experience on each individual task and overall user experience with the site and its functions. Allowing for feedback and comments provided complementary qualitative data to these ratings.


Analysis Phase
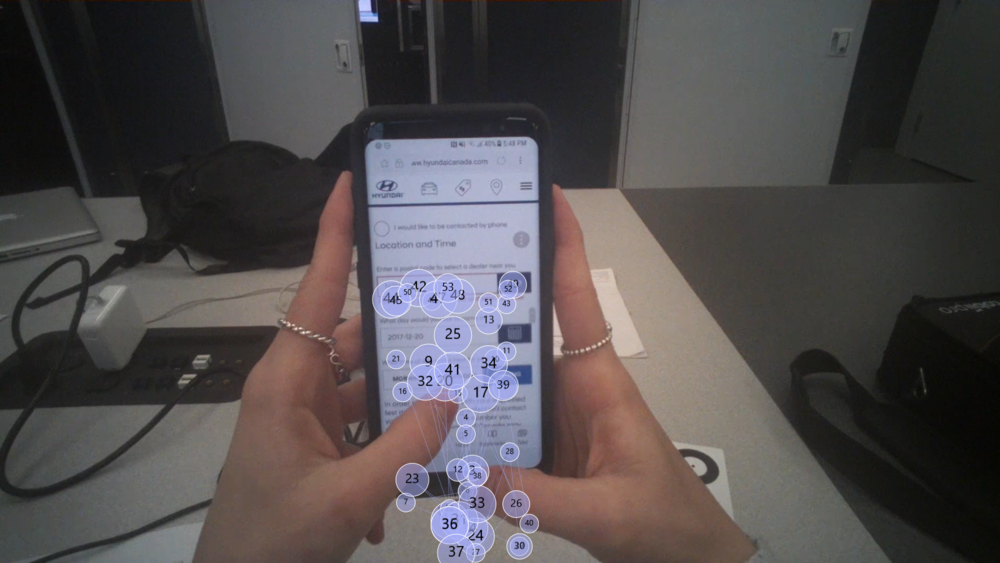
Understanding Scan Paths
Utilizing the Tobii eye-tracking software, gaze plots of our users were generated as they moved through each scenario. The gaze plots allowed for a better understanding of the location, order, and time spent looking at locations on the stimulus. The circles show the location of gaze, while the size of the circles represents time spent, and the numbers reveal the order.
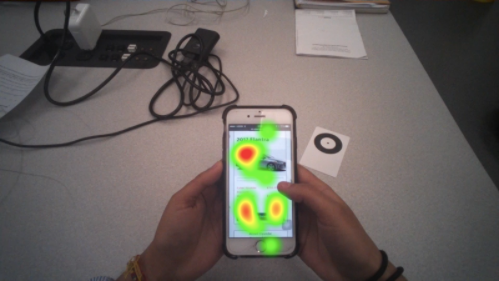
Understanding Heat Maps
Heat maps display how the user's gaze is distributed over the stimulus. Unlike gaze plots, there is no information regarding the order provided. The colours represented on the screen, which range from green to red, indicate the areas in which the user has looked at most.
See a User Testing Session
Opportunities for Design Improvement
-
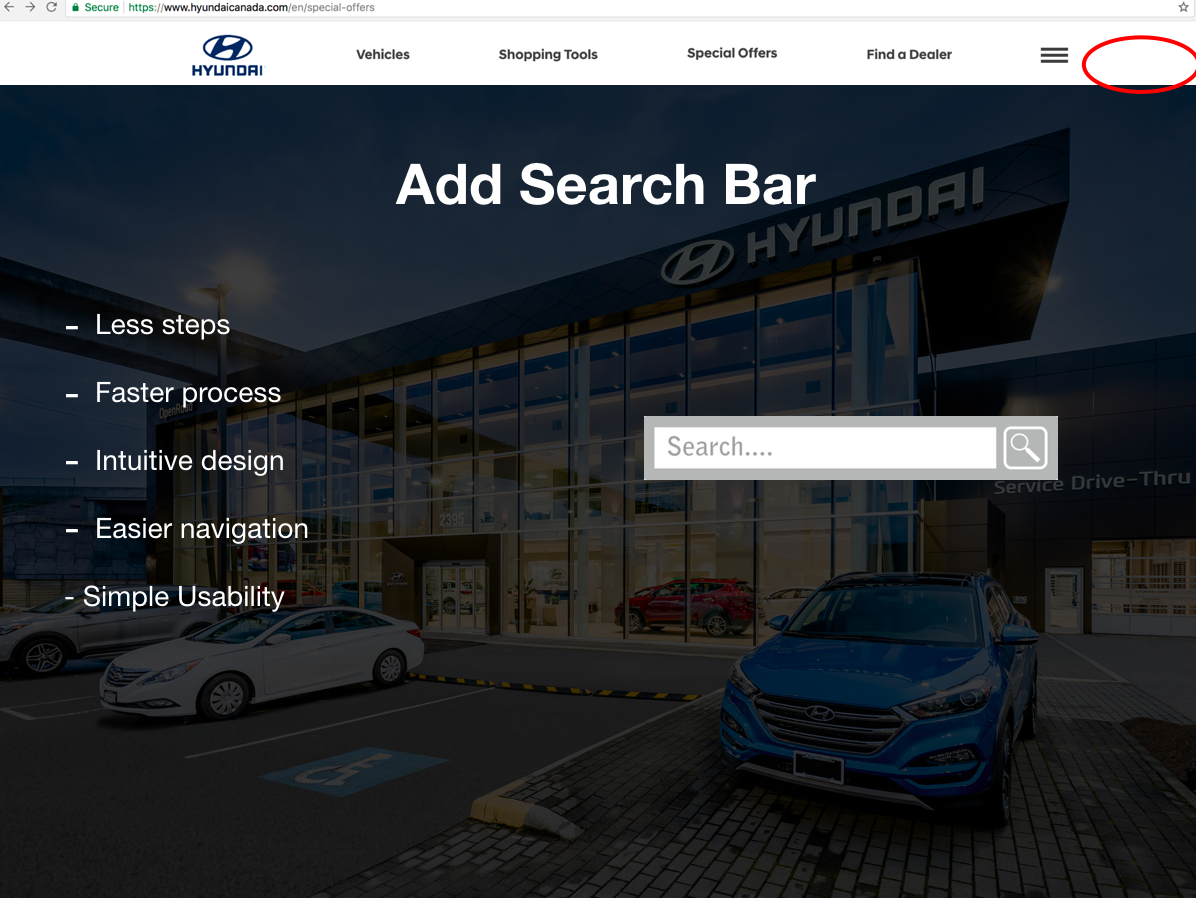
Search Bar
When browsing the website, users instinctively look for a search bar. Adding a search bar would make the purchasing experience quicker and more efficient while following the user's mental navigation model.
-
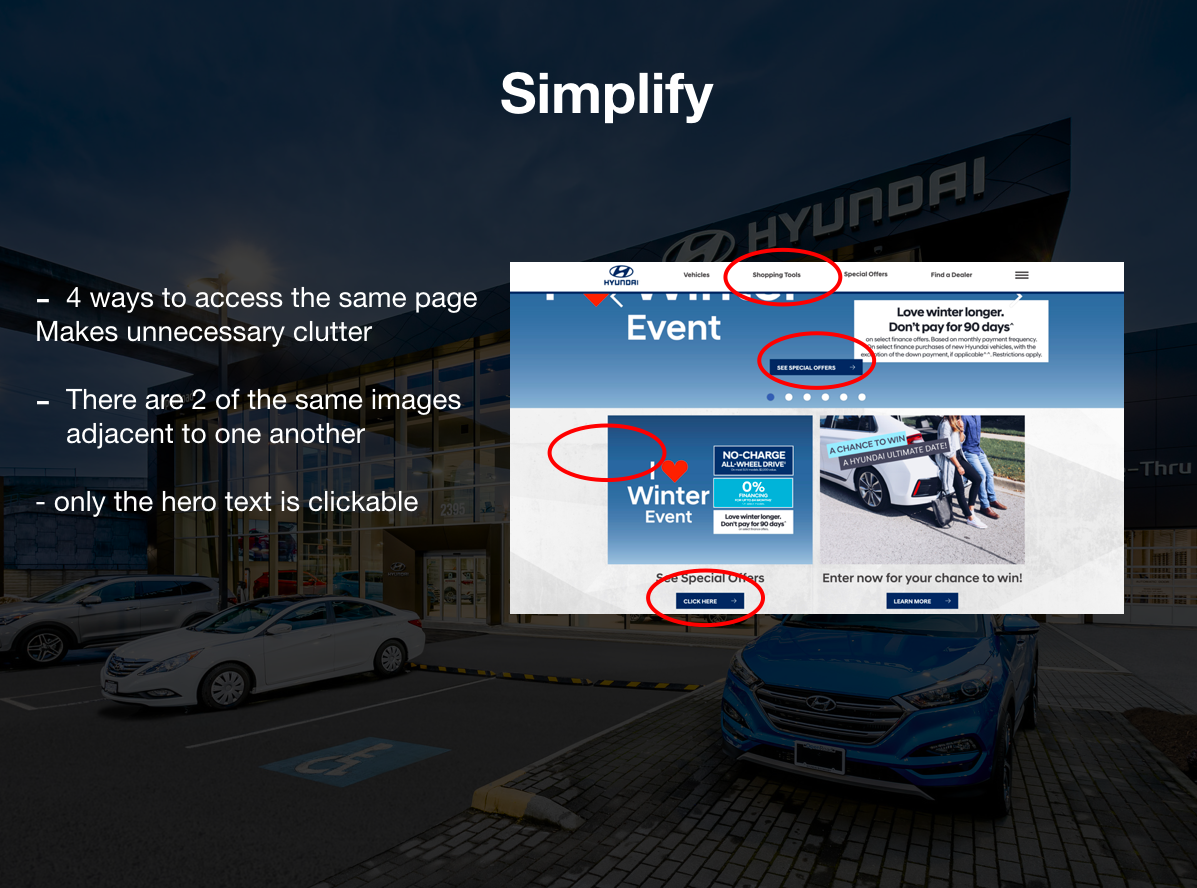
Simplify
Users found four different ways to access the same page, identical images adjacent to each other and unresponsive site elements. Simplifying the website so that the navigation bar is more accessible and repetitive elements are removed would improve the user experience.
-
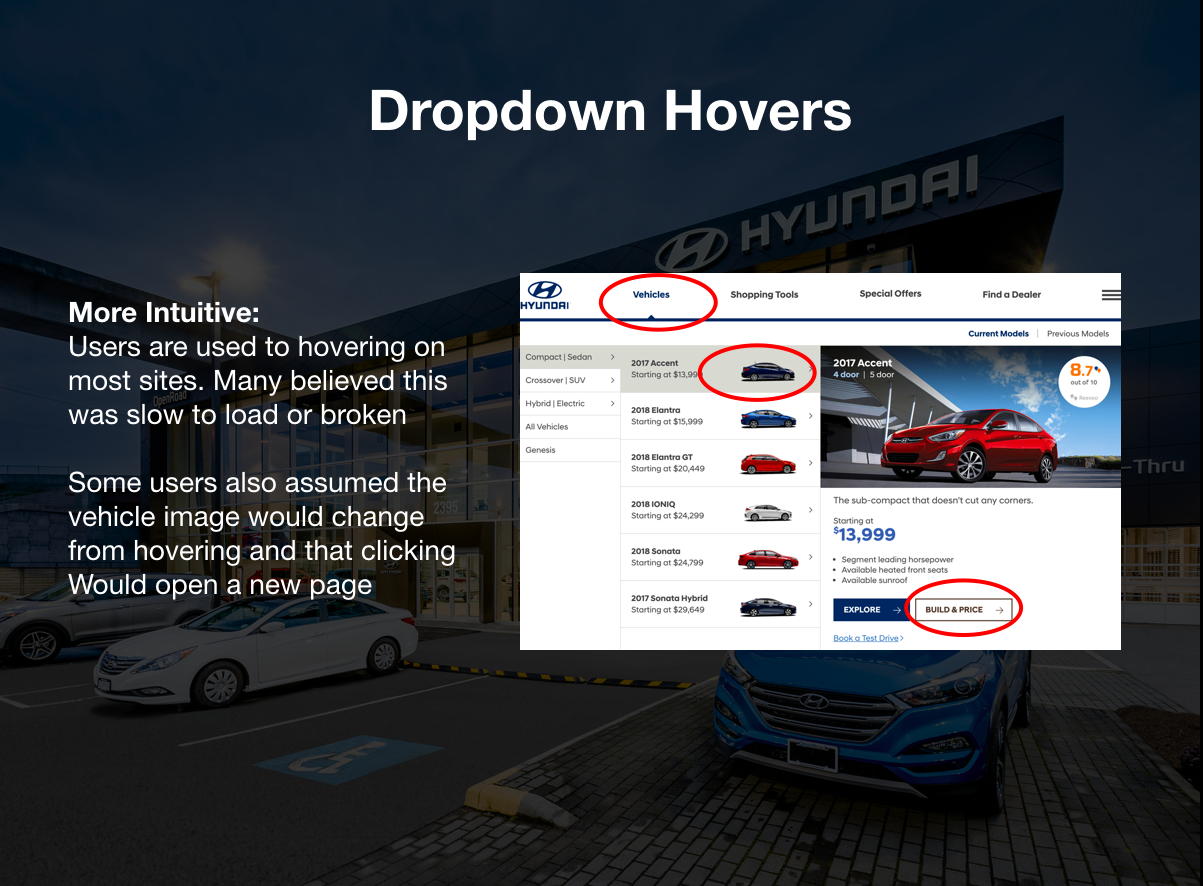
Dropdown Hovers
Confusion occurs when users hover over a dropdown menu, and the menu doesn't correspond appropriately or in the way that a user expects. Instead, users have to select an arrow button adjacent to the menu for the menu to populate. Enabling dropdown hovers would eliminate this confusion.
-
More Options
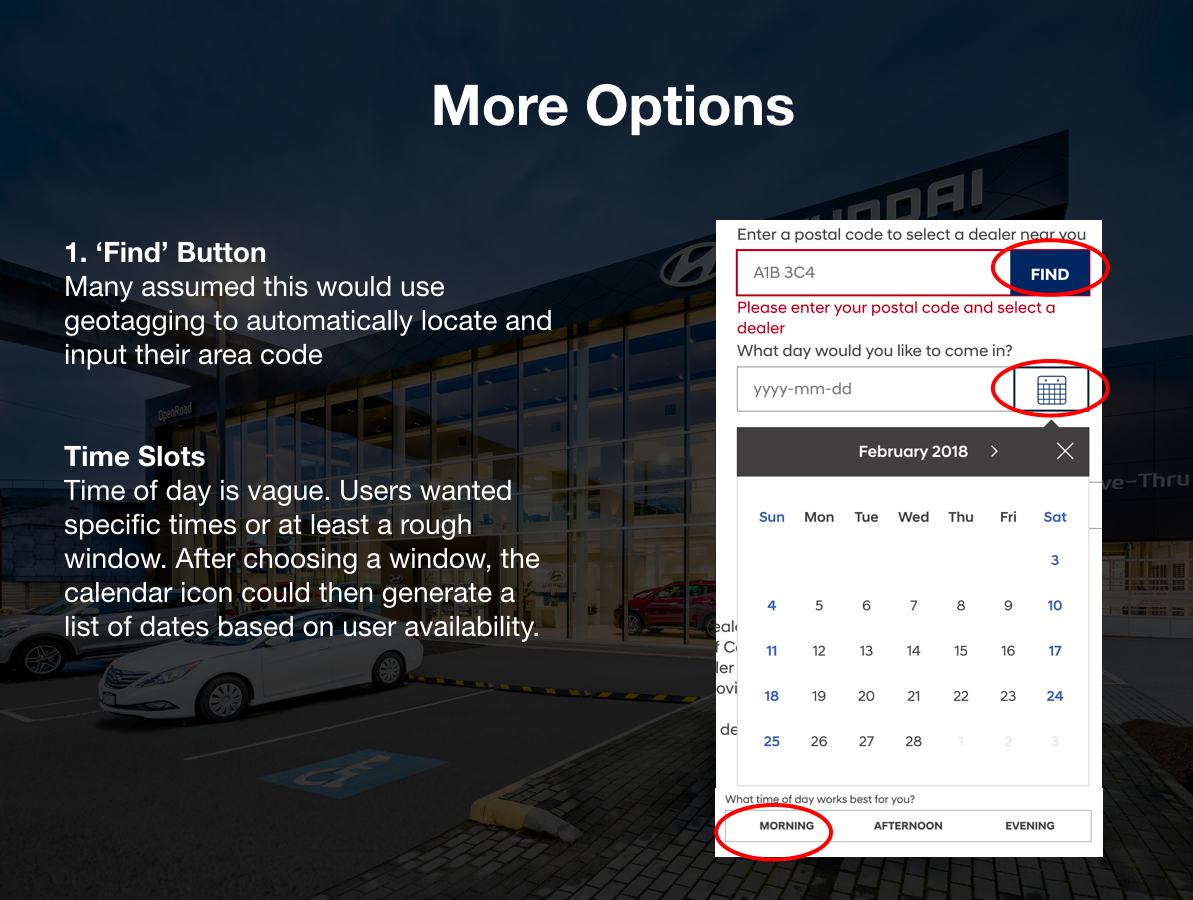
Users find inputting information into the "Book a Test Drive" feature is unnecessary. Hyundai would benefit from allowing this feature to geotag users' locations and auto-populate this information accordingly.
The time slots for booking a test drive are too broad and should be more precise. Instead of selecting a segment of the day, users should be able to schedule appointments by the hour.
-
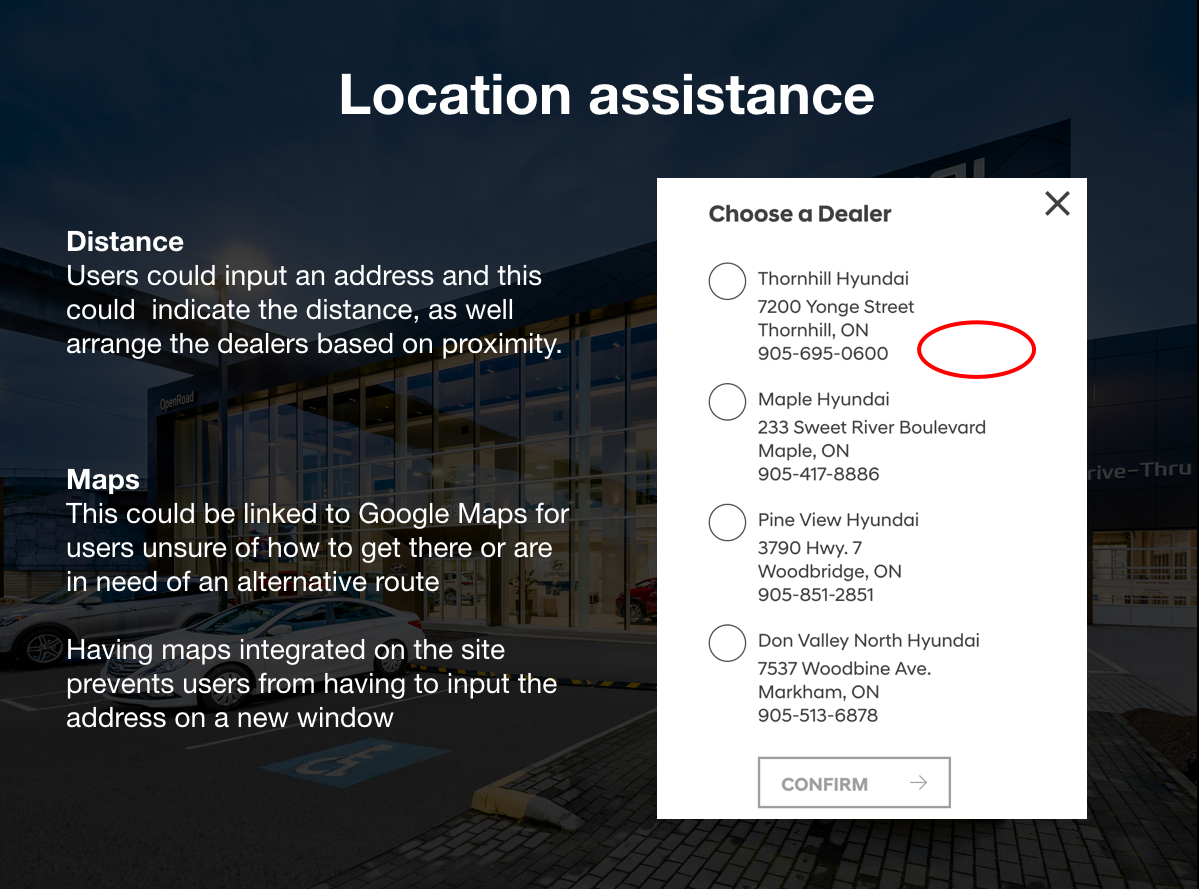
Location Assistance
Users would benefit from knowing how far (km/miles) dealers are from their location when inputting their postal codes. Integrating a maps option (i.e. Google Maps) would provide a visual aid and allow users to locate dealers more efficiently.
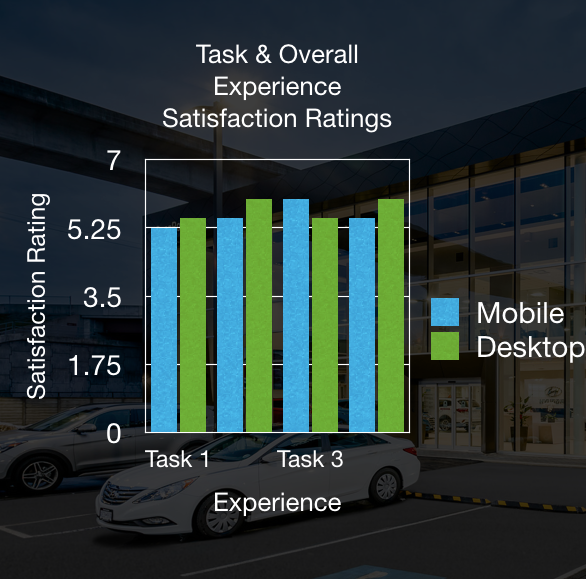
Satisfaction Ratings
Based on the Usability Scales, most users are satisfied with their experience on both the mobile and desktop platforms of the Hyundai Canada website. The desktop platform provides a slightly more enjoyable overall experience. It was interesting to note that after completing task 3, where users utilized the “Book a Test Drive” feature, the mobile platform delivered a more enjoyable user experience. This could be due to the task requiring fewer steps to complete than prior tasks and its ability to be completed on the go.

Next Steps
-

Wireframing & Prototyping
Having presented these findings to the stakeholders at Hyundai Canada, next steps include wireframing early concepts based on the design recommendations and feedback and then developing these into hi-fidelity prototypes.
-
User Testing
After flushing out concept designs and creating prototypes, testing each iteration will be necessary to decipher whether the corrections and new features created have been successful and improve the User Experience of the Hyundai Canada website.